In the previous post I dealt with the popular pressure and temperature sensor BMP180, which is already going out of production. Today I’ll check its younger brothers – the BMP280, which measures temperature and pressure as well, and the BME280, which can additionally check how humid the…
atmosphere 😉 Let’s get cracking!
BMP280
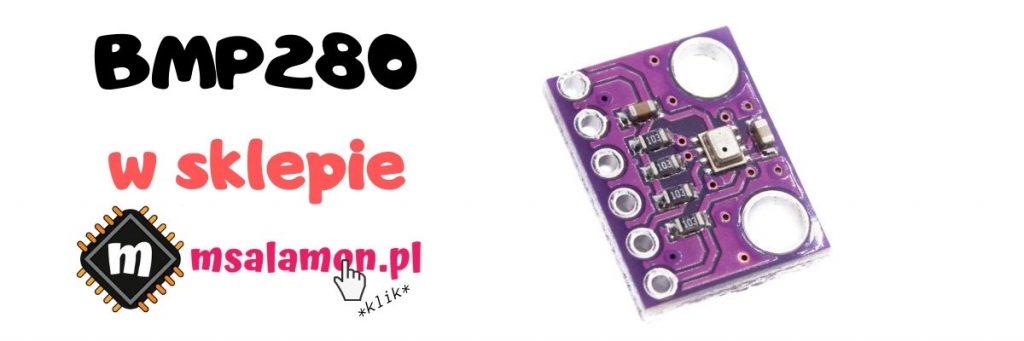
The wiring diagram with the Nucleo F401RE board basically hasn’t changed. The Chinese module with the BMP280 is this time called GY-BMP280 and has 6 pins. The last two have pull-ups on the PCB to their default positions, so there’s no need to connect them anywhere.
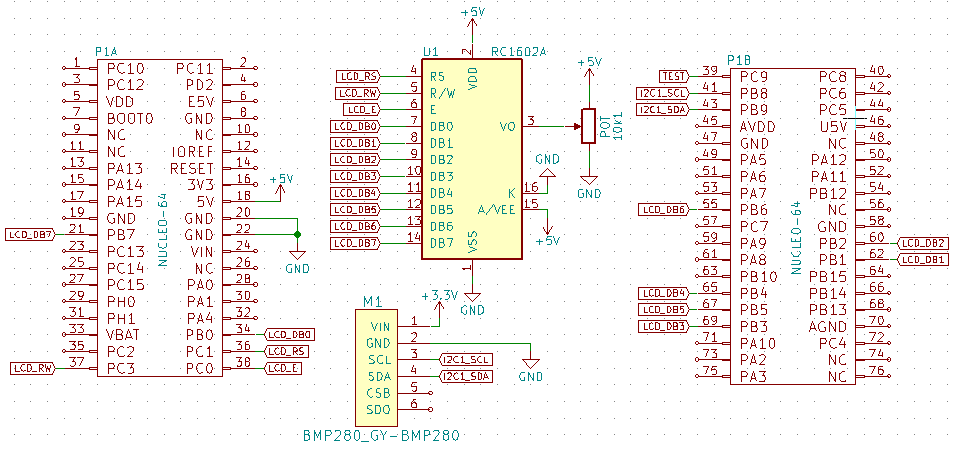
The STM32CubeMX configuration doesn’t change at all compared to the BMP180.
The BMP280 documentation contains a great comparison table with its older counterpart. Let me just paste it.
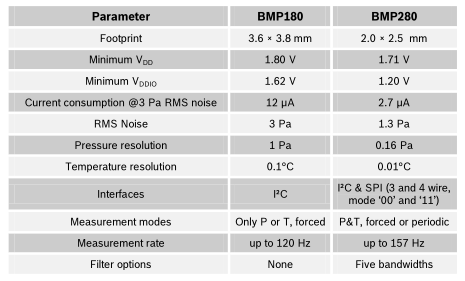
The differences that matter most to me include its external dimensions. It’s clearly smaller, which makes me happy because I already have an idea for using this sensor. Bosh highlighted a significant difference in current consumption here, which is also a big plus. For a weather station application, the resolutions don’t play a huge role, but it’s nice that they’re higher. The table doesn’t list measurement accuracy. Why? Because it’s the same as the older brother. Communication via SPI. That might be useful for someone. Chinese modules generally don’t support it.
An important difference lies in the operating modes. The newer BMP280 doesn’t allow separate temperature and pressure conversions. In the previous post I checked the conversion time for temperature only and for temperature + pressure. I have to drop the former here.
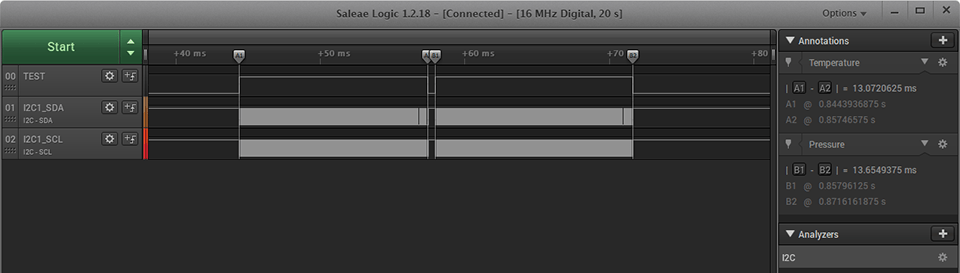
The new sensors introduced a new operating mode. The mode similar to what I did with the BMP180 is the forced mode. To use it, you need to start the sensor in sleep mode. Then, when you want to perform a conversion, write data corresponding to the forced mode into register 0xF4. This starts the conversion process, which is signaled by a conversion-in-progress flag. In theory, you should wait for this flag to clear. That’s the theory, but the BMP280 played tricks on me. At a 100 kHz clock, the flag would set with a delay lasting roughly as long as checking whether the mode of interest had been invoked. That was tolerable (I was sure it entered forced mode), but at 400 kHz I couldn’t tell when the flag would set so I could then wait for it to clear. What did I do? I ignored the flag. Instead, I check whether the sensor has already exited forced mode. After the measurement finishes, the BMP280 automatically leaves this mode and lands in sleep. And that works great! What do the waveforms look like for forced mode?
100 kHz
400 kHz
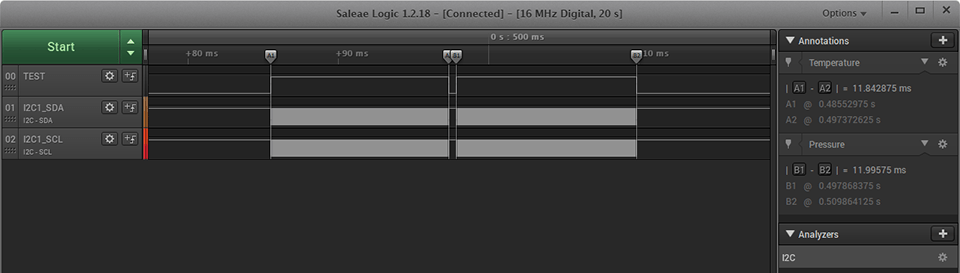
The difference between the functions for reading temperature and pressure is negligible. This is related to combining the conversion of these two quantities, so I’ll skip further discussion of separate conversions. The timing differences visible in the plots relate to the additional readout of the pressure register and conversion of raw data to a proper value. That’s why I added a function to the library that returns two values via the pointers passed as function arguments. Two birds with one stone 🙂
It would be good to present the conversion times for different accuracies in a table. Here the BMP280 adds an extra step of measurement accuracy versus power consumption. There are 5 in total. I took measurements with a 16-bit temperature conversion resolution – as in the BMP180. Increasing the temperature resolution increases the conversion time – obviously. I’ll skip those tests because 16 bits for this quantity is a very nice result anyway. Oh, and I gave up measuring with a crude delay. In the previous post I already concluded it’s not needed at all. Here are the results:
| 100 kHz | 400 kHz | |
| Ultra Low Power | 7,73 ms | 6,07 ms |
| Low power | 9,7 ms | 8,1 ms |
| Standard | 13,64 ms | 11,96 ms |
| Highres | 21,53 ms | 19,89 ms |
| Ultrahighres | 37,32 ms | 35,74 ms |
BME280
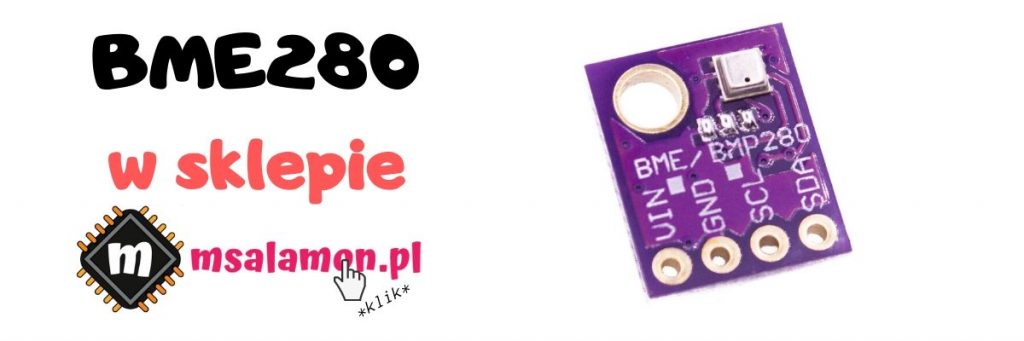
This guy is a BMP280 extended with humidity measurement. Even Chinese modules can be identical, and the most common difference is a dabbed marker on a different square indicating the version of the mounted sensor (or not dabbed, like mine). Compared to the BMP280, it’s also slightly larger physically, as its dimensions are 2.5 x 2.5 x 0.95 mm. A 0.5 mm difference on one side isn’t a big deal, though. It should fit in a BMP280 footprint without issue. However, the most important change is adding relative humidity measurement, performed with an accuracy of ±3 %RH and a resolution of 0.008 %RH. The temperature range for full 0÷100 %RH operation is available for temperatures from 0÷65 °C. In the -40÷0 °C and 65÷85 °C ranges it’s somewhat limited at the top end, as you can find in the documentation. As with the other measured quantities, the humidity conversion draws very little current. With 1-second sampling it’s typically 2.8 μA. The temperature and pressure measurement parameters are almost identical to the BMP280. The measurement modes and resolutions are similar as well. The temperature and pressure measurements are theoretically completed in the same time as for the BMP280. So how much does adding humidity measurement extend the conversion time? Let’s check!
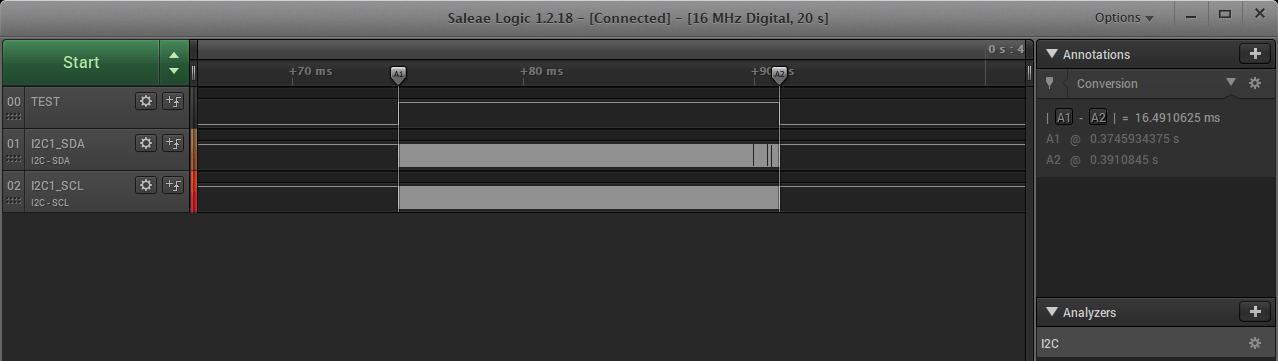
I trigger the conversion once in forced mode, collect the data, and compute the results in a single function. For the lowest sampling, the readout waveform looks as follows:
100 kHz
400kHz
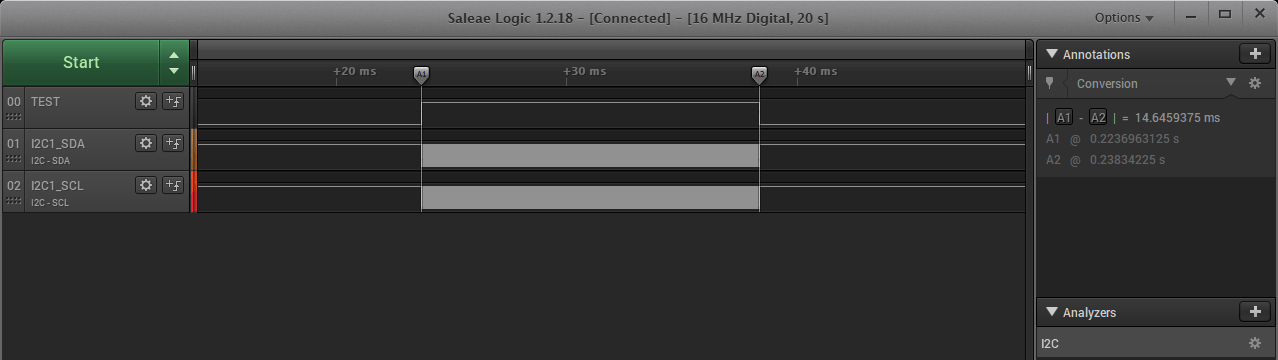
The additional humidity measurement increases the overall conversion time by about 3 milliseconds compared to the conversion of temperature and pressure alone by the BMP280. However, this is the lowest possible humidity measurement accuracy. Below is a table with results for all oversampling levels. Temperature set to 16-bit, pressure to standard.
| 100 kHz | 400 kHz | |
| Ultra Low Power | 16,49 ms | 14,65 ms |
| Low power | 18,46 ms | 16,67 ms |
| Standard | 22,41 ms | 20,64 ms |
| Highres | 30,31 ms | 28,58 ms |
| Ultrahighres | 46,45 ms | 44,39 ms |
As a curiosity, here’s the time to obtain results for all the lowest options and the highest ones on the BME280 sensor.
| 100 kHz | 400 kHz | |
| All lowest | 10,58 ms | 8,736 ms |
| All highest | 99,72 ms | 98,05 ms |
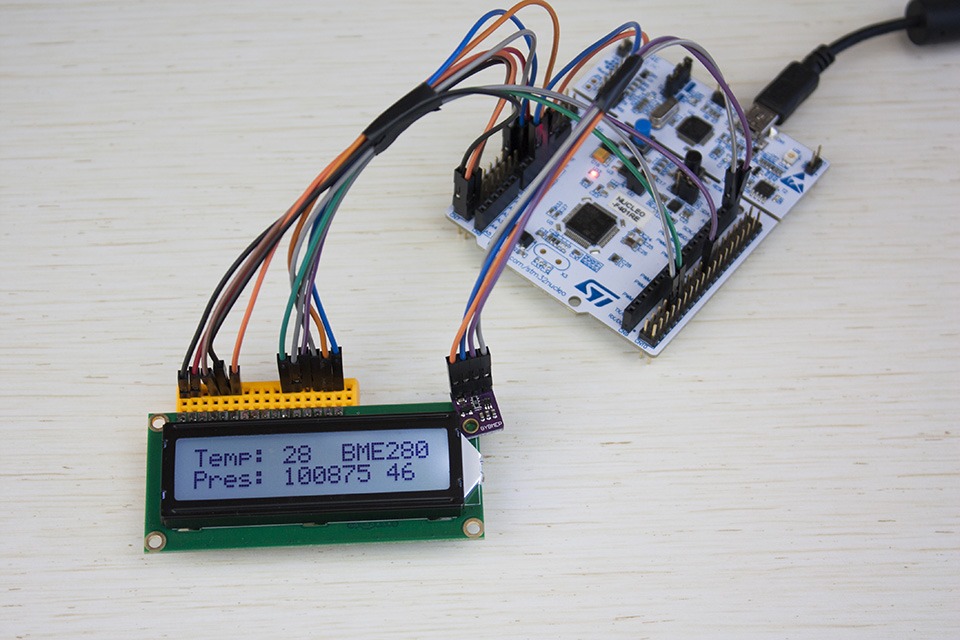
The spread is huge, and you need to answer what really matters in your project. In a battery-powered device you’ll probably want to go toward the lowest oversampling and resolution values. For mains power you can go for the highest options. In that case, remember to design the system so everything still runs smoothly. 100 milliseconds may not be much for a human, but that wait time, e.g. between display frames with simple control, may already be uncomfortable for the device user. There’s also another option besides manually forcing conversions.
Normal mode
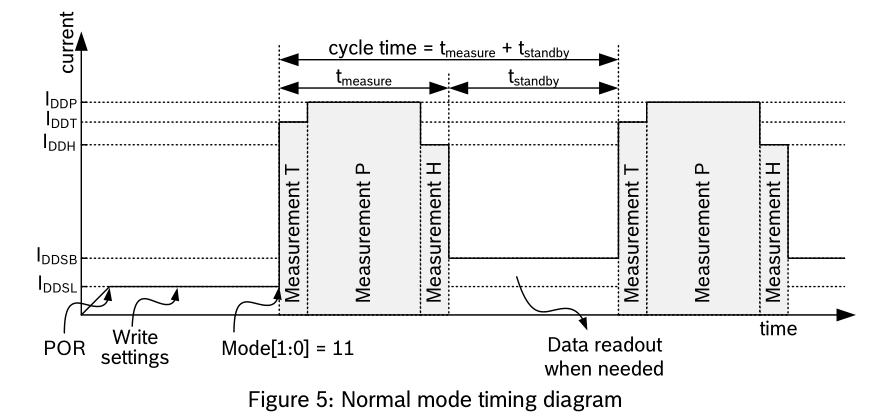
Undoubtedly a big change compared to the BMP180 is the addition of the periodic (normal) mode. What does it give you? Automatic, cyclic conversion of temperature, pressure, and, if present, humidity. The sensor doesn’t need our signal to start conversion – the measurement is performed cyclically without MCU intervention. Thanks to this, the subsequent readout is much faster. But nothing is free. Cyclic conversion also means a cyclic increase in current consumption. Keep this in mind when designing a battery-powered device. It’s also worth mentioning that the BMP280 and BME280 are set to normal mode by default. In this mode, you can read just one parameter or all parameters at once. How long does it take? An example for the BMP280:
100 kHz
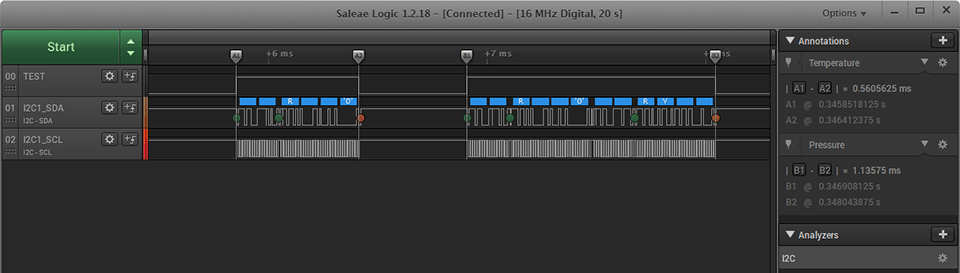
400 kHz
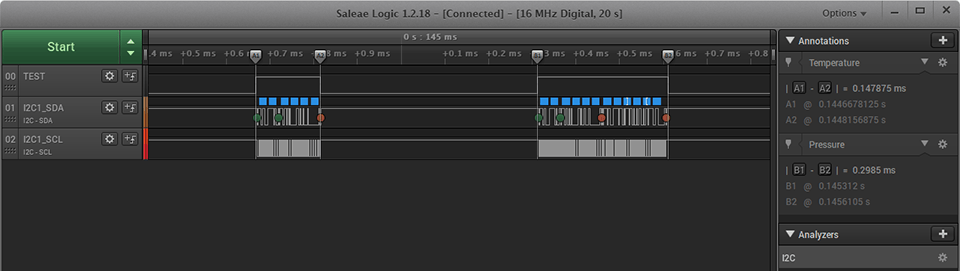
Compared to forcing conversion and waiting for it to finish with the BMP180 and in forced mode, this is blazingly fast. Sub-1 ms time is impressive. In my opinion, this mode is worth using on mains power. On battery? It depends on requirements. You’d need to do deeper tests over a longer period to see whether cyclic measurement has a big impact on runtime from a cell. The right time for that will come 🙂
In the configuration register, the primary setting is the idle time (i.e. interval), which is between successive conversions.
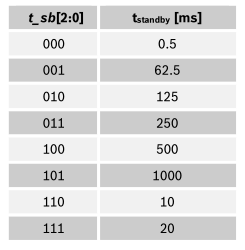
I think this is fairly straightforward to understand. If not, the documentation has an appropriate diagram for it. This is the t_standby time.
The second parameter you can set is the IIR filter for pressure measurement. It’s an infinite impulse response filter. Why is it here? Pressure is a parameter that can change very quickly over time (e.g. a puff of air). That’s why the BMP/BME280 have a built-in filter that mitigates such disturbances. By default it’s disabled and, for example, it isn’t particularly recommended for building a weather station. For a drone, however, it is. You’ll find more information about how it works in the sensor datasheet.
That’s it for this two-post series about the popular pressure sensors from Bosch. Thank you very much if you’ve made it this far. I encourage you to check out my other posts.
If you liked the sensors, you can buy them in my store: BMP280, BME280.
You’ll find the source code used in this post on GitHub: link
If you noticed an error, disagree with something, or simply feel like discussing the topic, write a comment. Remember that the discussion should be polite and follow the rules of the Polish language.
Podobne artykuły




0 Comments